Business Process Mining: The Enterprise Monitoring Framework Part 3
 Following the discussion of monitoring business processes and services, the focus now shifts to a reference architecture that would provide the environment for collecting measurements in order to meet the objectives of BDIM, process mining, and general monitoring support. A monitoring reference architecture provides the framework to build an enterprise monitoring architecture. There have been various research studies conducted on monitoring frameworks for different environments and applications [1, 2, 4, 6]. Kanstrén and Savola [3] describe the fundamental requirements of a monitoring framework as being scalable, secure, correct, adaptive, and intrusive. As computing and application landscapes must support interoperability to function and exchange data and information, so do monitoring environments. Interoperability therefore is another significant requirement that a monitoring landscape needs to support.
The monitoring reference architecture depicted in Figure 1 comprises six basic components. South facing are the domains. Each domain may have its own controller and its own monitoring architecture, depending on the diversity of functionality between domains. Domains describe a certain functional, technical, or geographic area that contains a number of agents or probes. Domains and agents constitute an abstract term. Agents can be of either internal or external nature. External agents are stand-alone units that monitor for events. Internal agents provide measurements to the domain and are embedded in the software components either through functions or subroutines. Agents are capable of probing for measurements depending on their configuration.
The diagram provides examples of different domain types. All domains interface with the measurement data provider interface. This interface should be considered as a plug-in architecture with a standard protocol for message exchange and measurement message structure. To service the interface, a common measurement message structure is required. Such a structure could be MXML as described by van Dongen and van der Aalst [5]. MXML is a meta XML model for describing the measurements required for process mining. The data element in the structure should contain document type and reference number for business documents such as order number, delivery number, picking number, and invoice number. All messages received from the domains are either already transformed into the MXML structure or are mapped as part of the interface. In this context, the MXML message structure represents the canonical structure of the framework interface.
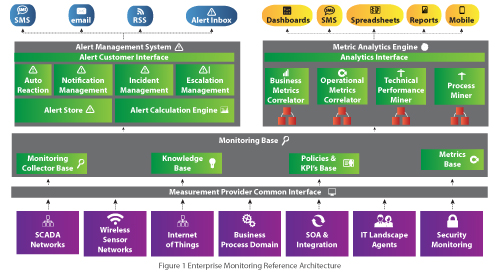
The monitoring base layer describes the central database components for an enterprise-wide monitoring infrastructure. It is made up of four central schemas: the database for storing the measurements; a knowledge database that contains rules for measurement evaluation and alerting; a central policy and KPI store that describes constraints for key performance indicators; and, finally, the metrics base that describes in general the changes from green to yellow to red to yellow and green.
The next two components (i.e. alerting and metric analytics) retrieve their data from the monitoring database. Alert functionality has its own unique requirements and therefore is discussed explicitly in the next section. The metric analytics engine uses information cubes which extract the data from the underlying monitoring base for data mining. There are four distinct areas of potential data mining and analytics that support a holistic view with drill-down capability across the enterprise. First are the analytics and data mining patterns related to determining the performance of business processes correlated back to technical metrics. Since the objective is to identify and measure generated business value by IT, the business metrics need to be correlated or mapped to technical metrics. Operational analytics refer to service levels as discussed in the previous section. Other measurement examples could include security failures or breaches, failed login attempts, and password resets.
The technical performance miner provides information on general system performance and the status of the health of the overall computing and application landscape. Usually the analysis focuses on system availability, exceptions, usage, and capacity. The system availability is concerned with uptimes, as well as planned and unplanned downtimes of the different computing instances of a landscape. System exceptions provide information on exceptions within system logs and traces as well as application logs and message logs.
The final component is the process miner that validates business processes for correctness based on the event logs. Depending on how sophisticated it is, the process miner might reconstruct the business process from the event logs and validate the result to the documented version of any business process design tool. Process mining is also concerned with performance, but from a business process perspective. It provides the capability to simulate the flow of documents and to identify bottlenecks so that corrective actions can be taken.
The results of all these different analysis components are published through a common analytics interface. This interface has to have the ability to provide the data in summary form but also allow for drill-down functionality. It must also be able to present business and operational processes interactively to show document flows and information flows.
The Alert Framework
The alert framework works parallel to the monitoring framework. It relies on the data collected through each of the domains in the databases. However, the primary function of the alert framework is to detect alerts and manage the escalation process of alerts. The central component of the alert framework is the alert calculation engine. Its function is to determine what constitutes an alert. This is based on defined and configured alert thresholds, which are part of the rules and KPI database. If an alert event is recognized, a special entry is made in the alert store. There are two main challenges with generating alerts for the alert calculation engine..
The first challenge is what is referred to as the phenomenon of “alert flooding.” This happens when alerts are constantly being fired and the system cannot differentiate between meaningful alerts and useless ones. The problem with this is that alert recipients will have to differentiate among hundreds of alerts and identify what is actually of concern. This can lead to alert apathy, where alerts are ignored altogether and those that are actually valid do not incite action. Therefore, intelligence is needed to determine not only configured metrics but also the overall health (i.e. state) of the affected component, and whether an alert is valid or should be dismissed. This also requires that the alert calculation engine be able to self-adjust thresholds on past incidents and therefore have the capability of intelligent learning.
A second scenario happens when alerts are raised repeatedly for the same incident. In contrast to alert flooding in which a large number of alerts are triggered for various reasons, here the same alert is raised continually for one incident. A reason could be that within the given time interval, the alert has not been acknowledged or confirmed. This scenario is of particular concern if alerts are to automatically raise help desk incidents.
The alert framework has four sub-functions that are responsible for the notification and escalation of alerts. The notification process can be triggered based on levels of concerns as described by the RACI classification (Responsible, Accountable, Consulted, Informed) [7]. The incident management function is the interface to any incident and change management application. Finally, the escalation engine determines the right escalation process for alerts based on their severity and priority. This information should also feed into any dashboard application that shows the general health status of computing components on the landscape.
The monitoring reference architecture with its domain and agents describes the origination of the measurement. The definition, scope, and implementation of a domain and agent occur at the design and implementation phase of the framework. By correlating the measurements based on time, domain, agent, and measurement point/type, one can provide utilization information on the supporting computing resource for the overall business process and its parts. Since a business process and its components can be part of multiple domains, it is possible to analyze the process from various perspectives. This approach therefore facilitates a full 360° view of the business process and its supporting components.